I've created a sample dimension table to show how it's done. Below is how it looks like,
The SQL Query that would select the correct records based on the date would look like below,
The client wanted to select a date range and Power BI should show distinct count of members that are current based on the end date selected. Below are the steps I used to achieve this,
Note: There is a seperate date dimension called dimDate that's used in date filters.
Step 1: Create a measure that will get the max date selected
I have used two functions, MAXX and ALLSELECTED. ALLSELECTED will disregard any context set by the dimCustomer dimension.
Step 2: Create another measure for the counts.
I will be using the CustomerNumber column to count the customers.
I'm using a variable here to avoid context transition and the max date value will stay unchanged for all the customer records.
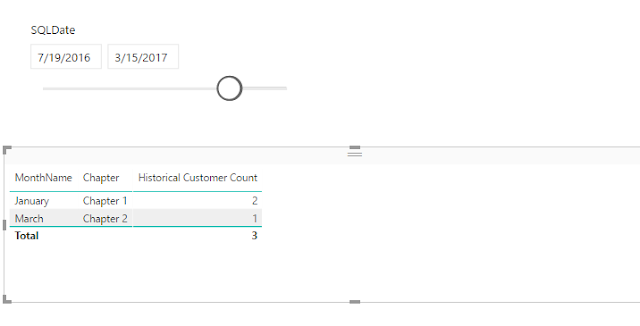
Step 3: using the Date slicer and the new measure in a table
To look at the detailed records, i included the CustomerNumber column as well
Hope this is helpful. Please let me know what you think and if there are better ways of doing this.
Cheers!


1 comment:
what is this table3 in urs second dax query
Post a Comment